

Bitcoin Price Prediction: 2024, 2025, 2030

BTC price prediction: Key highlights
1. Primary support and resistance levels
- An analysis of the weekly time frame revealed $40,000 as the lowest probable support for BTC in 2024.
- As the king coin ascends, it can face its highest resistance at around $70,000 to $75,000.
2. Market sentiment
- In July 2024, the BTC market is slightly bearish.
3. Predictive forecasts
- Our AI/ML predictive algorithms forecast that Bitcoin’s value will likely average close to $2 million in 2028 and over $16 million in 2031.
Stay informed on BTC’s future trajectory through a comprehensive weekly technical analysis, followed by coming days of the month, upcoming months, and yearly forecast tables derived from our AI/ML-based predictive models:
BTC technical analysis: Is a bear market returning?
In 2023, BTC demonstrated a remarkable recovery from its lows in 2022, showcasing a year of significant volatility and growth. This year, the king coin started out experiencing a massive bull run. Yet, the recent downturn has posed many challenges. Many analysts anticipate the Bitcoin price prediction for 2024 will be monumental as the price can achieve record-breaking levels.
The period under review started with the coin facing rejection at $30,000, leading to subsequent declines. Thus, the price fell back to the lowest yearly support at $25,000 by mid-August.
It wasn’t until the end of October that BTC finally broke through the upper level. Continuing this rally, the price successfully claimed $40,000 by December. After this, the price consolidated between this support and the resistance at $45,000.
In February, BTC experienced a significant bullish breakout that saw the cryptocurrency surge through $45,000 for the first time since April 2022. This growth was attributed to the launch of BTC spot exchange-traded funds (ETFs).
As the month progressed, bullish momentum intensified, with $52,000 converted into a support level by the end of February, highlighting the rally’s strength. Concurrently, Bitcoin’s market capitalization reclaimed the $1 trillion mark, as per CoinMarketCap.
The uptrend carried into March, and Bitcoin hit $73,777 on Binance, surpassing its previous all-time high (ATH). However, a retracement occurred, with prices dropping as low as $60,000 the following week.
Despite this pullback, BTC managed to retest the high chart resistance at $71,000 towards the end of the month. A broader market crash followed, pushing the coin to $60,000 again.
The highly anticipated halving event did not trigger a massive surge in the price or lead to a sell-off. While the altcoins experienced bull rallies, BTC remained relatively stagnant. Moreover, April marked the first time since BTC ended the month with a negative price return.
By mid-May, optimism started to rebuild as the price pumped to retest the yearly high resistance. Yet, it retracted once more. AMBCrypto credited this drop to the May U.S. jobs report. As a result of this decline, the market capitalization also suffered.
The market continuously bled throughout June, compromising the four-month held support at $60,000 by July. AMBCrypto reported a notable influx of over $1 billion worth of BTC sent to exchanges in the first week of July. Additionally, Mt. Gox conducted a test transaction of over 1,000 BTC to prepare for planned payouts to creditors, moving $2.7 billion worth of Bitcoin to a new address. These transactions triggered widespread panic, raising fears of massive sell-offs in the community.
The king coin slightly recovered to exchange hands at $57,333 by the end of the analysis period. This uptick was triggered by whales buying the dip. AMBCrypto’s recent analysis revealed that although the coin lacked the bullish sentiment and demand necessary for a swift rally, traders should not overlook the possibility of a breakout above $60,000.
Several experts are forecasting significantly higher valuations for Bitcoin. These predictions suggest that BTC could escalate to monumental price points of $100,000 to $150,000. This optimistic outlook hinges on its ability to push past a critical threshold of $70,000 to $75,000. Sustained momentum above these levels can likely put $80,000 on the cards.
Nevertheless, the potential for further downtick is scrutinized amidst the market uncertainty. Thus, bearish predictions suggest a drop to the $52,000 mark and potentially lower. A decisive downtrend could see Bitcoin’s value dropping to between $45,000 and $40,000. Such a scenario would likely be temporary, paving the way for BTC to rebound and attain new heights.
Based on the future predictions from our predictive models, BTC is forecasted to experience a significant increase in value. Within four years, the coin is anticipated to trade at an average price of around $2 million. Looking ahead, the projections become even more striking.
Our models predict that Bitcoin’s average price will exceed $16 million by 2031. This long-term forecast highlights Bitcoin’s expected continued growth and adoption as a major digital asset in the financial landscape.
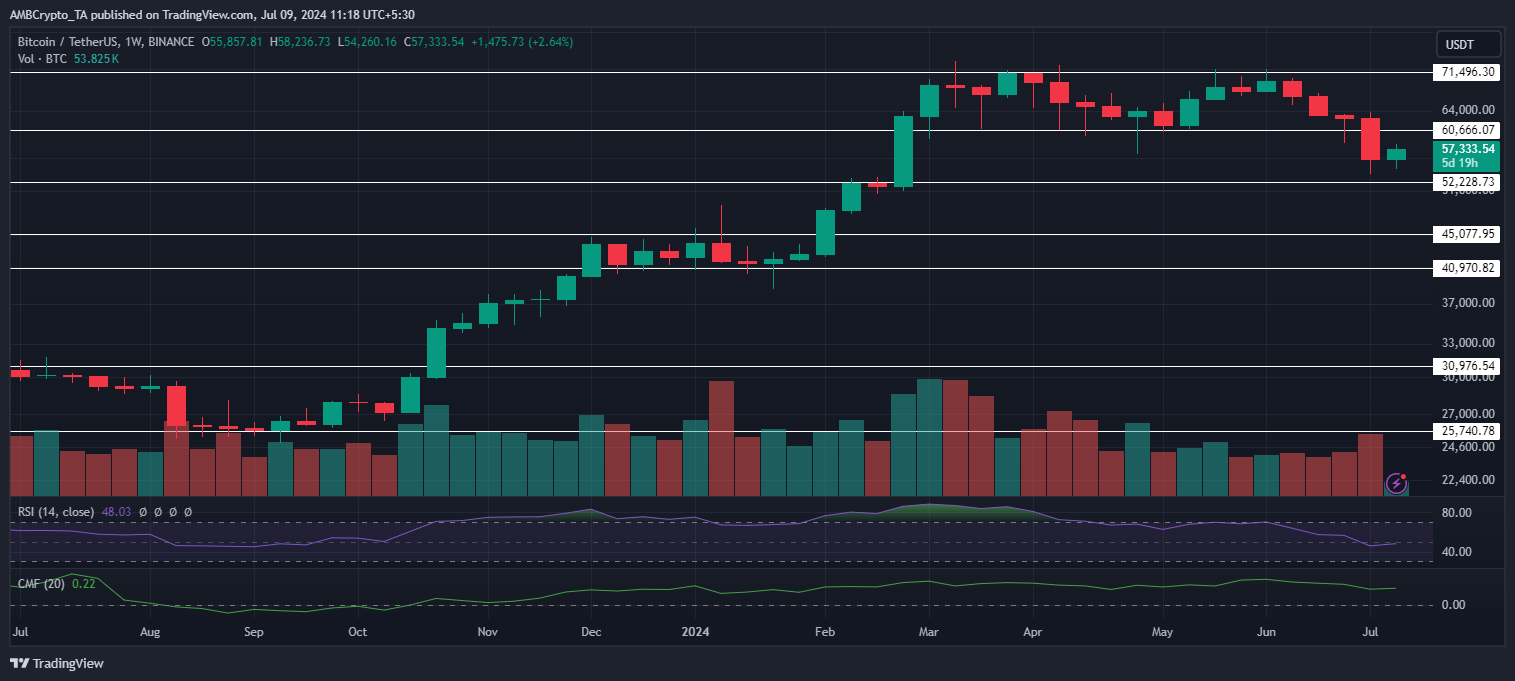
BTC’s 2024 roadmap: Key indicators to watch and trade
- The Relative Strength Index (RSI) mainly exhibited bullish behavior, with a notable dip below 50 as prices fell to their lowest support. It entered the overbought territory by October’s end, only to recede in January.
- In February, the RSI climbed above 70 again, peaked in March, and dropped below. This downtrend intensified in June, pushing the indicator below the 50 line by July. It ended the period at 48.03, indicating a slight uptick in a bearish bias.
- The Chaikin Money Flow (CMF) exhibited a similar pattern, peaking in mid-July before declining below the zero line from mid-August to mid-October. Subsequently, the indicator predominantly trended upwards, with a press time value of 0.22. This marked a decrease from earlier highs, indicating a resurgence of selling pressure.
- The trading volume mirrored the price movements. The bullish rallies saw the volume recover significantly, indicating that they were backed by substantial investor interest. In addition, the latest downturn was also reflected in the volume, highlighting withdrawal.