

Bitcoin Technical Analysis on Google Sheets: A Beginner’s Guide | CoinGecko API

Technical analysis is a method used in financial markets to predict future price movements of assets by analyzing historical market data. It focuses on price and volume patterns, and operates on the assumption that the price reflects all available information, moves in trends and tends to repeat historical patterns.
In today’s guide, we’ll cover:
- How to import historical Bitcoin price data into Google Sheets with an API
- How to import historical Bitcoin price data into Google Sheets with a CSV
- How to perform a technical analysis on Bitcoin, to develop a Bitcoin price prediction for the upcoming halving
With much ground to cover, let’s jump right in!
How to Import Bitcoin Historical Prices into Google Sheets (with an API)
Follow these steps to import historical Bitcoin price into Google Sheets:
- Install an API connector on Google Sheets.
- Generate your CoinGecko API key.
- Input your request URL and API key into the API connector.
- Run the query and organize the data.
- Set up a refresh schedule or manually refresh to update the data.
Note: You will require a paid CoinGecko API plan to import more than one year of historical price data.

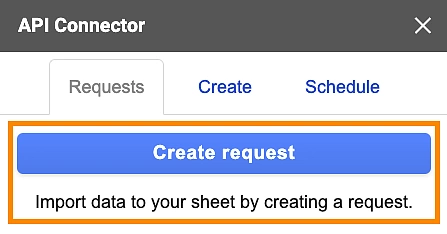
For this tutorial, we’ll be using the API connector by Mixed Analytics. After installing the API connector add-on on Google Workspace Marketplace, run the extension from Google Sheets Extensions.
Create a request to import data accordingly.
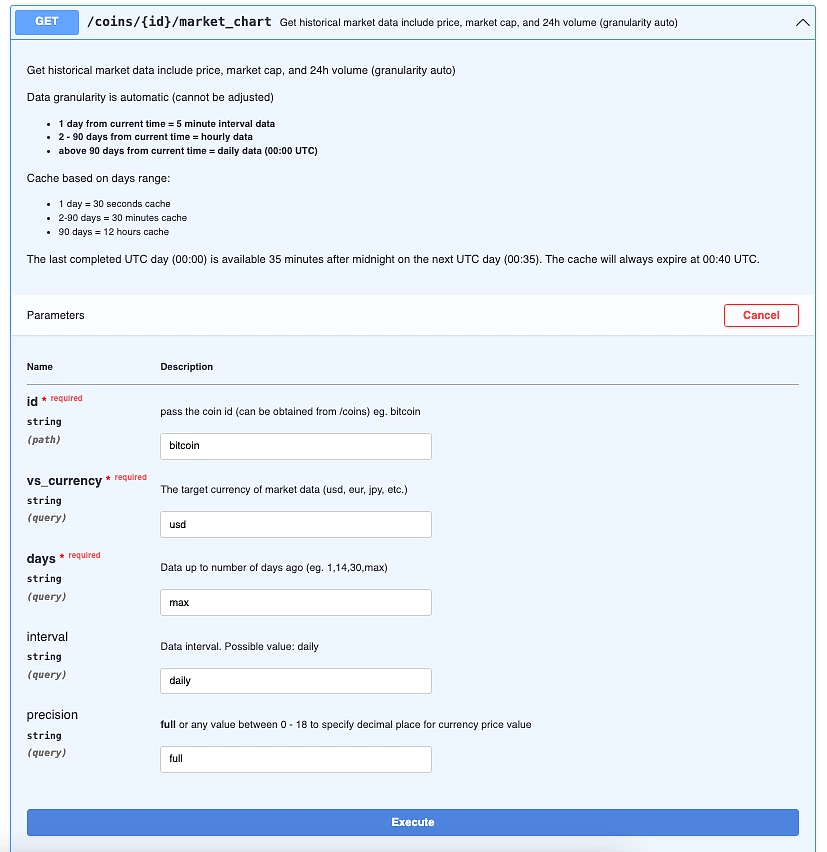
Navigate to the /coins/{id}/market_chart endpoint on CoinGecko API’s documentation. Fill in the parameters accordingly to derive the request URL.
- id: bitcoin
- vs_currency: usd
- days: max
- interval: daily
- precision: full
Since we’ll be calling the pro API, change the root URL to https://pro-api.coingecko.com/api/v3. The full request URL now appears as such:
Feed this request URL back into the API connector. Under ‘Headers’, fill in the following:
- Key: x-cg-pro-api-key
- Value: Your API key (i.e. CG-XXXXXXXXXXXXXXXXXXXXXXXX)
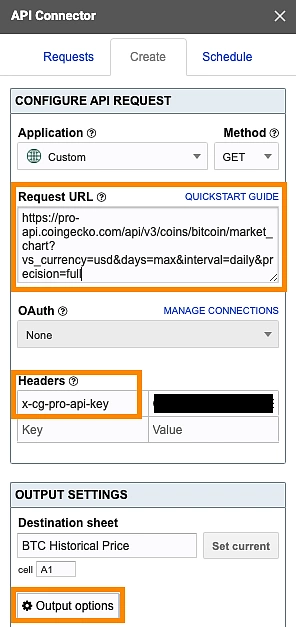
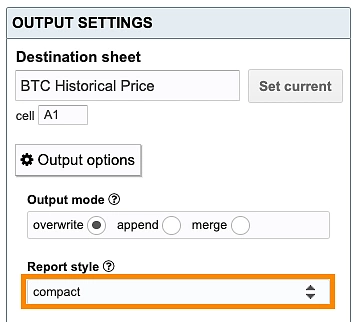
Next, select ‘Output options’ to expand the settings, and update the report style to ‘compact’.
Run the query and you’ll see Bitcoin (BTC) historical price data imported into Google Sheets, in the following format:
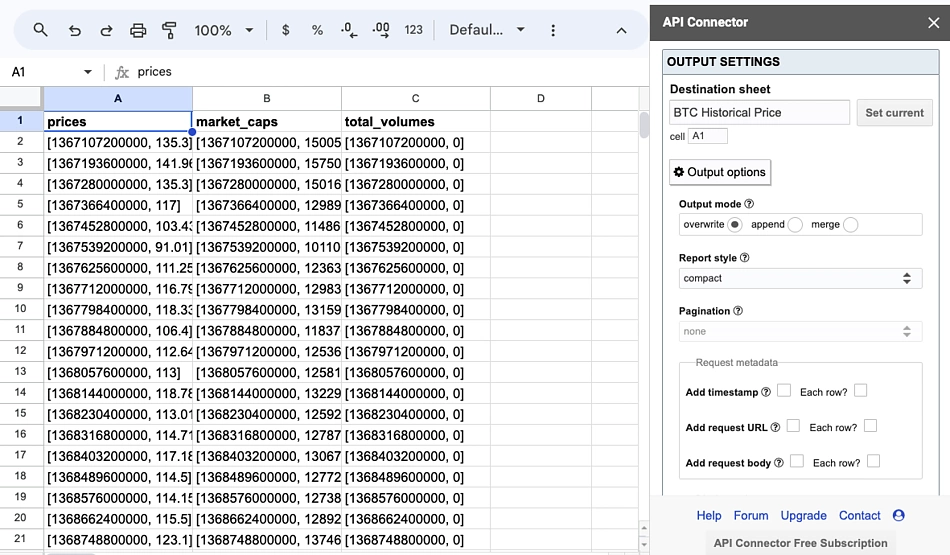
Each cell under prices, market_caps and total_volumes contain nested data within the ‘[ ]’ brackets. The first value within the bracket displays the Unix time for that corresponding price, market cap and trading volume. The second value within the bracket shows the Bitcoin price, market cap and trading volume for that corresponding Unix time.
To convert Unix to a human-readable date, we’ll first split the cell values for row A (prices) by applying the following formula in cell F2.
=SPLIT(SUBSTITUTE(SUBSTITUTE($A2,"[",""),"]",""), ",")
Repeat the following for rows B (market_caps) and C (total_volumes), applying the formula for all cells in the column.
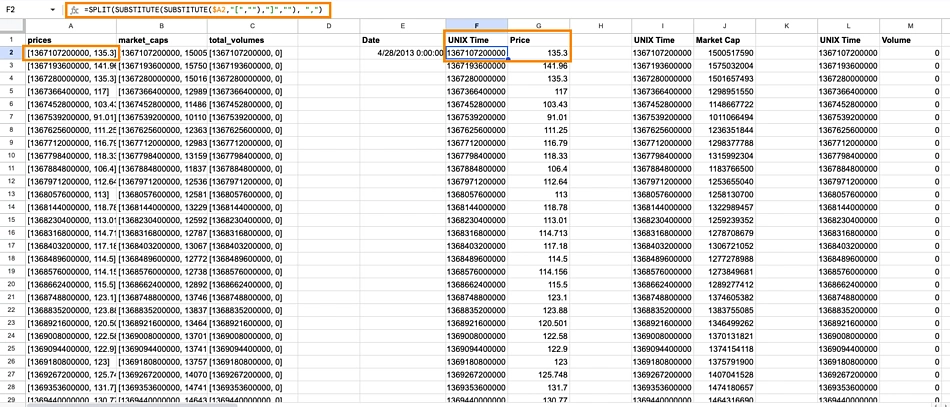
To convert Unix time to a human-readable date, we’ll apply the formula =EPOCHTODATE().
From the screenshot below, we can see that the date for the first Bitcoin price and market data is captured on April 28, 2013 at 0:00:00 UTC.
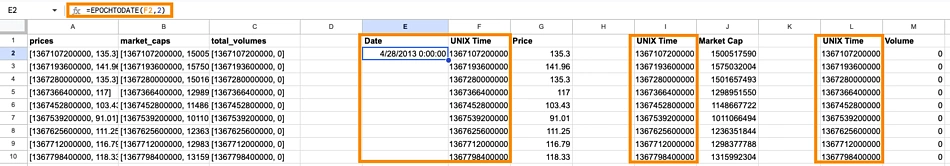
Similarly, apply the EPOCHTODATE() formula on all cells in column E, to convert Unix time for the imported data.
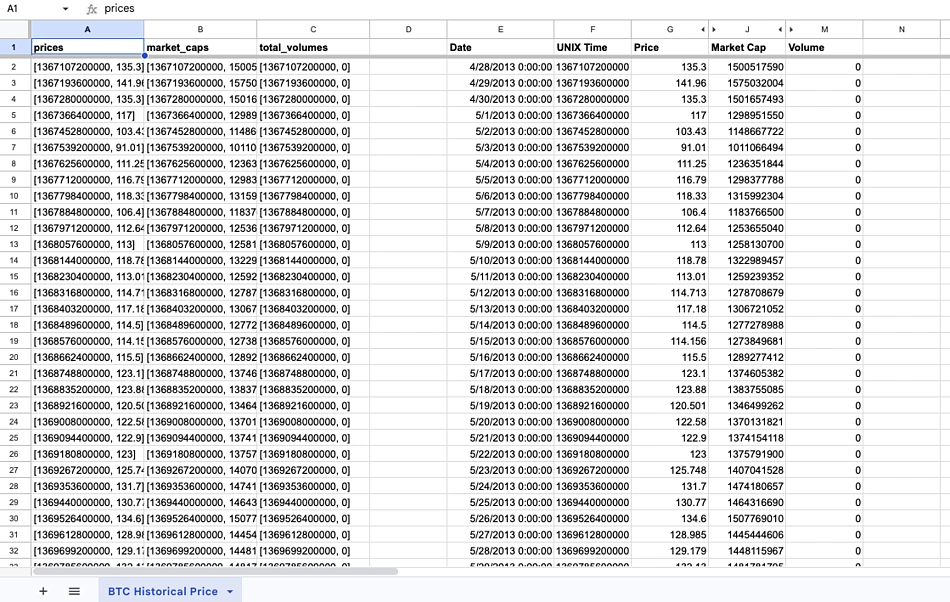
Since the corresponding Unix time is the same across Price, Market Cap and Volume, we can hide the subsequent repeated columns.
Finally, we have an organized data set for historical Bitcoin (BTC) price in Google Sheets.
CoinGecko users can enjoy a 30% off lifetime MixedAnalytics subscription by applying the code “COINGECKO” when installing the integration.
You may also look to duplicate this integration for other cryptocurrencies for technical analysis.
We’ll now look at another way to import historical Bitcoin price data into Google Sheets.
How to Import Bitcoin Historical Prices Data into Google Sheets (with a CSV)
We can retrieve Bitcoin historical price data in Google Sheets through a CSV exported from CoinGecko’s Bitcoin page.
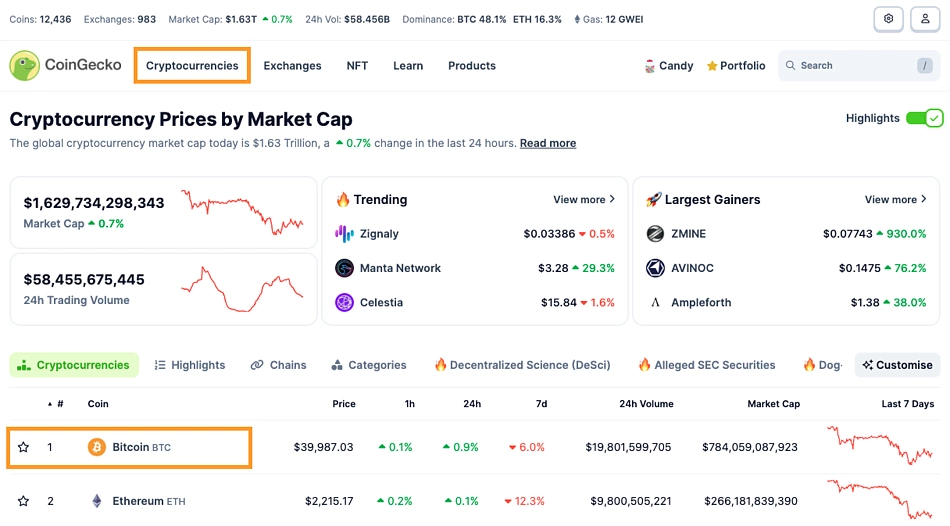
We can access the Bitcoin price page on CoinGecko by clicking on ‘Cryptocurrencies’ from the CoinGecko home page. From there, Bitcoin (BTC) will appear as the top line item when the list of cryptocurrencies are sorted by market cap.
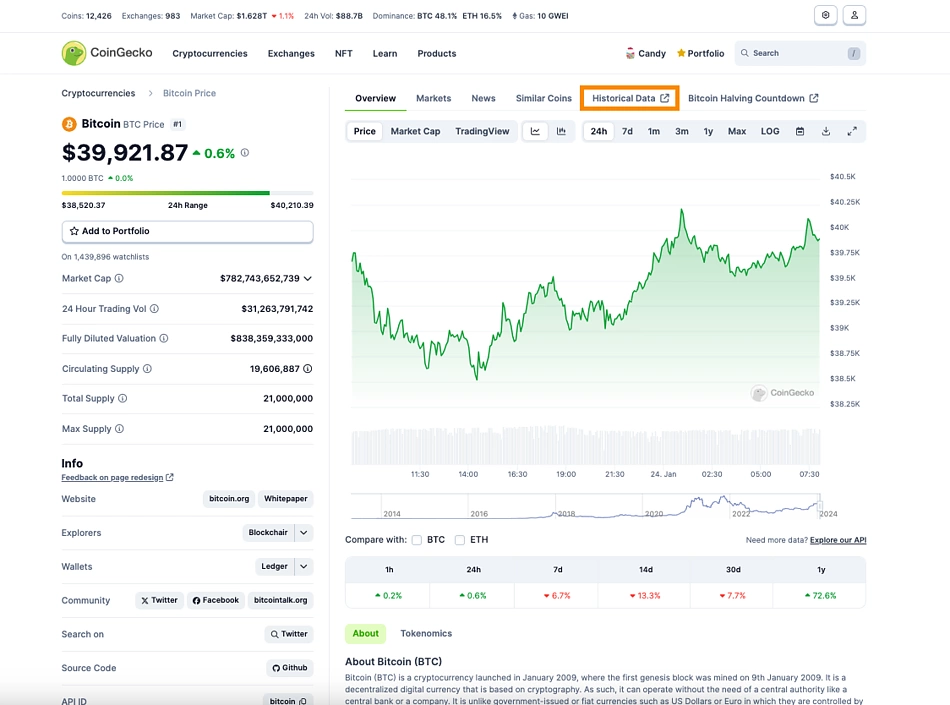
Once you’re on the Bitcoin page, select “Historical data” to view all historical data points for Bitcoin.
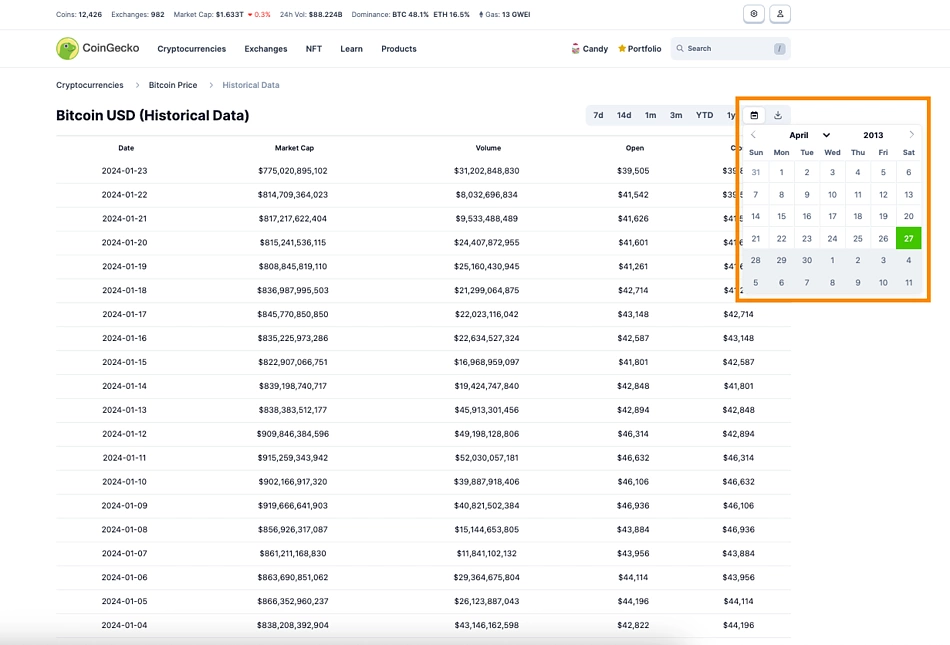
From the Bitcoin historical data page, select the calendar icon at the top right and input your preferred time coverage. Once the data refreshes, tap on the ‘download’ icon next to it to export the historical BTC price data in either the .xls or .csv format.
Create a new Google Sheet, select ‘File’, ‘Import’, and find your .csv file. With that, we have BTC historical data accessible in Google Sheets.
Conducting a Technical Analysis with Historical Crypto Price Data
When conducting technical analysis, specifically chart analysis, the first thing we need to consider is the time frame. We need to zoom out in order to comprehend, for example, what occurs in daily time frames to make predictions in hourly time frames, or monthly time frames for weekly time frames, etc. Off this understanding, we can create an investment thesis that ‘invalidates’ our perception.
For example, if we think a breakout is going to occur, where the price of a cryptocurrency is going to surpass a former level of resistance, ‘invalidating’ our thesis would be when the price closes below a level X, as opposed to consecutively higher closes. Alternatively, we can form time-based invalidations, suggesting that the price should consecutively close above X to suggest a breakout.
To substantiate these perceptions, we need to identify levels of support and resistance. Resistance levels are prices that the asset struggles to surpass, and support are price levels the asset struggles to drop below. Identifiers of significant price levels that can help us isolate support/resistance include the bottom of a dump, the peak of a rally, an area of recurring tests, and consolidations (sideways movements) between impulsive moves (this Elliott Wave article deep dives into graph terminology).
In the process of identifying levels of support and resistance, we’ll again review data at a higher time frame (i.e. monthly/weekly/daily) to make inferences for lower time frames (daily/intraday). From this, we are looking for confluence, which are significant price points that occur on a multi-timeframe level.
How to Perform a Technical Analysis of Bitcoin
We can perform a technical analysis of Bitcoin by identifying support and resistance levels, using historical price data on Google Sheets.
To conduct a Bitcoin price prediction for April 2024, let’s first go back in time to assess trends during the first Bitcoin halving, which occurred on July 9, 2016.
We’ll start by creating three separate graphs with the data imported earlier:
- Monthly price data for 2016
- Weekly price data for 2016
- Daily price data for 2016
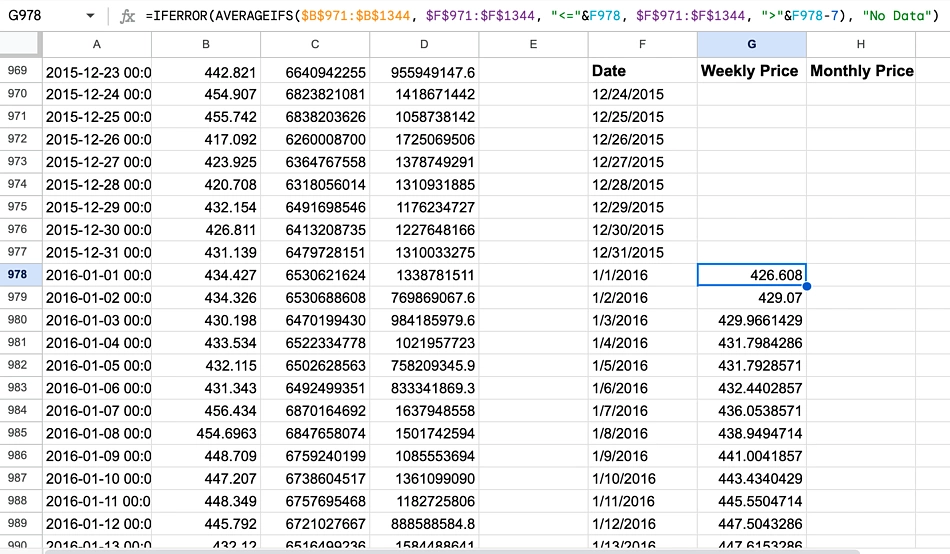
We will need to splice our imputed ‘date‘ column to a numeric form, for us to calculate the monthly and weekly prices. As we are only concerned with 2016, we will start at cell A978, which is 01/01/2016.
With the formula:
=DATE(VALUE(LEFT(A978,4)), VALUE(MID(A978,6,2)), VALUE(MID(A978,9,2)))
We can separate the time values into excel-readable formatting. Then we can calculate the weekly and monthly price data with the following formula, starting in cells G978 and H978 as shown above:
=IFERROR(AVERAGEIFS($B$971:$B$1344, $F$971:$F$1344, "<="&F978, $F$971:$F$1344, ">"&F978-7), "No Data")=IFERROR(AVERAGEIFS($B$971:$B$1344, $F$971:$F$1344, "<="&F978, $F$971:$F$1344, ">"&F978-31), "No Data")
For this, ensure you have created proper ‘date’…
Read More:Bitcoin Technical Analysis on Google Sheets: A Beginner’s Guide | CoinGecko API