

Bitcoin Technical Analysis – BTC/USD Bull Run is Here to Stay

Key Points
- Bitcoin price rocketed higher recently and moved to a new all-time high at $6456 against the US Dollar.
- There is an ascending channel forming with current support at $6250 on the hourly chart of the BTC/USD pair (data feed from SimpleFX).
- The pair might dip a few points from the current levels, but remains supported near $6300-6250.
Bitcoin price is super bullish above $6200 against the US Dollar. BTC/USD might continue to trade higher and it could even break $6500.
Bitcoin Price Upside Move
The past few days were excellent for bitcoin price as it remained above $6000 against the US Dollar. We even discussed about the recent bullish run above $6000 in the weekly analysis. The price gained pace recently and even managed to move above the $6400 level. A new all-time high was formed at $6456 where sellers appeared and defended further gains.
At the moment, the price is correcting lower and trading near the 23.6% Fib retracement level of the last wave from the $6085 low to $6456 high. It seems like there is an ascending channel forming with current support at $6250 on the hourly chart of the BTC/USD pair. An immediate support is at $6300. Below the mentioned $6300, the 50% Fib retracement level of the last wave from the $6085 low to $6456 high is likely to act as a support at $6270.
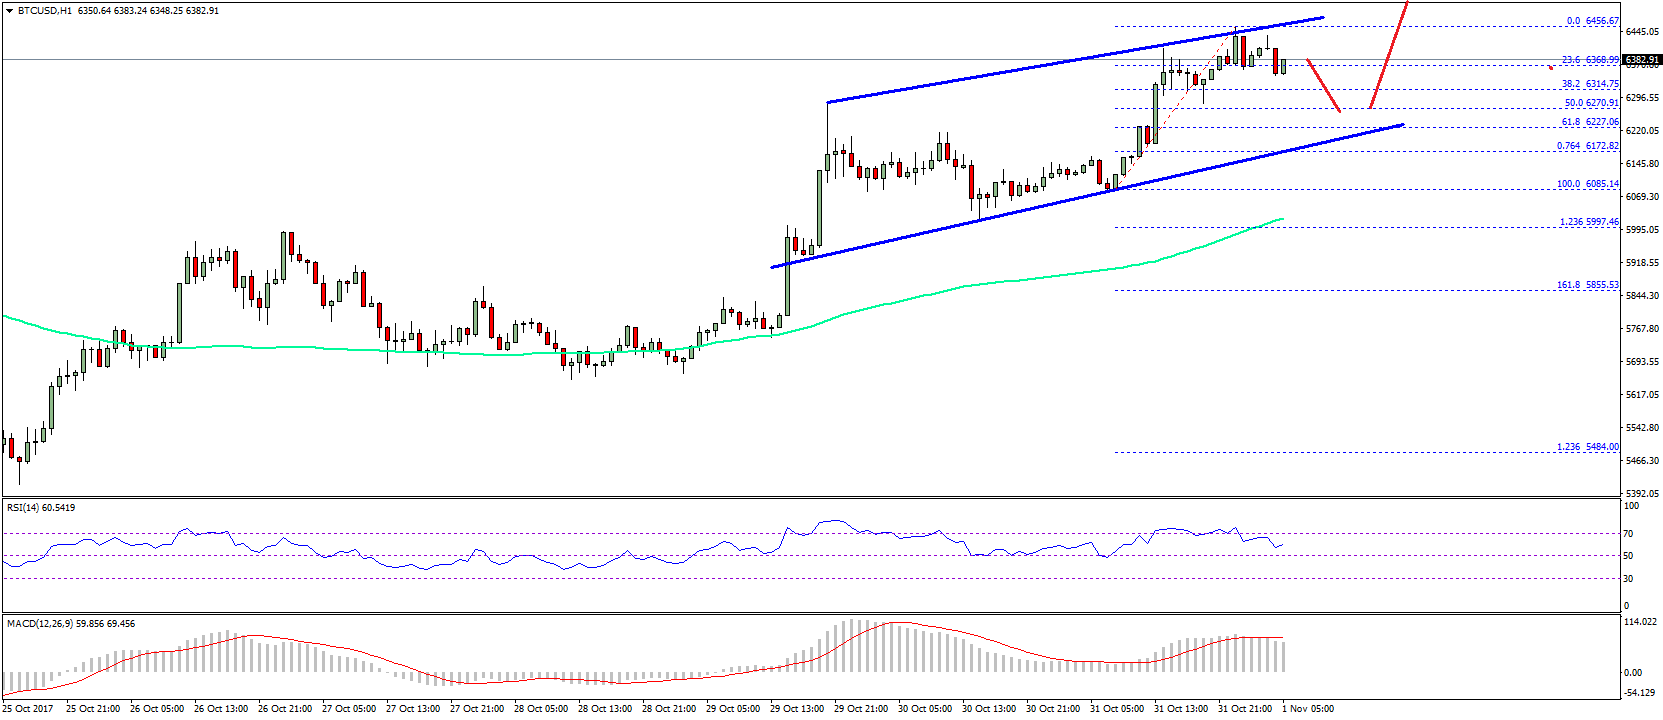
Any dips from the current levels remain supported above $6270-6250. On the upside, the channel resistance is near $6460. A close above the mentioned $6460 level would ignite an upside move towards $6500 or even $6600 in the near term.
Looking at the technical indicators:
Hourly MACD – The MACD is placed well in the bullish zone and showing positive signs.
Hourly RSI (Relative Strength Index) – The RSI is correcting lower towards the 50 level, but remains in the bullish zone.
Major Support Level – $6270
Major Resistance Level – $6450
Charts courtesy – SimpleFX
Read More:Bitcoin Technical Analysis – BTC/USD Bull Run is Here to Stay